We think we can!.. but that depends if we read your question correctly… this is what we think the answer is….
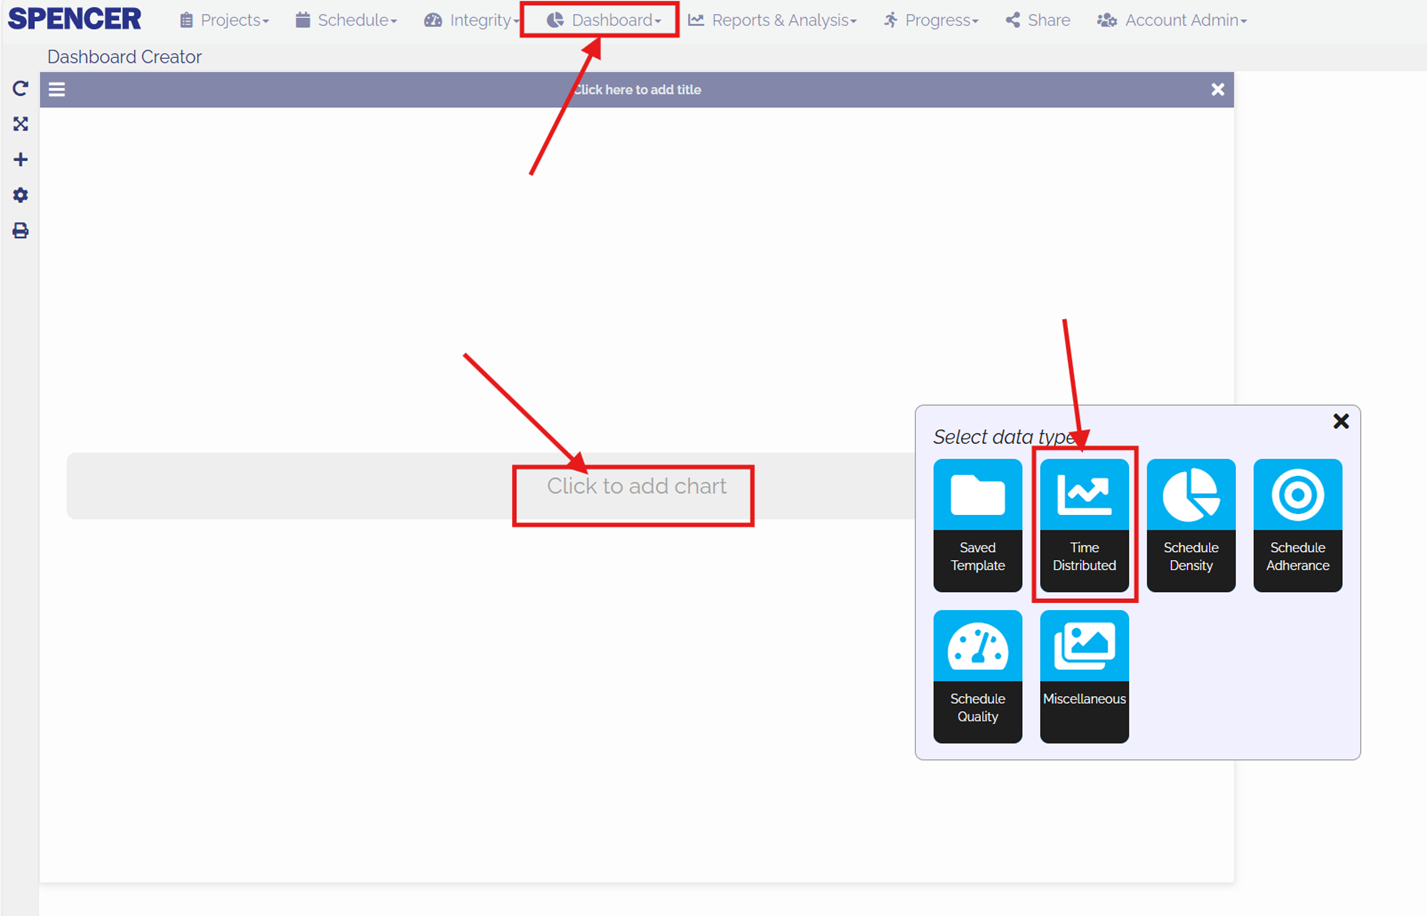
First go to the dashboard (after selecting your project in your projects), start with a blank dashboard, then hit the “Click to add chart” to bring up the “Select Data Type” interface and click on the “Time Distributed”
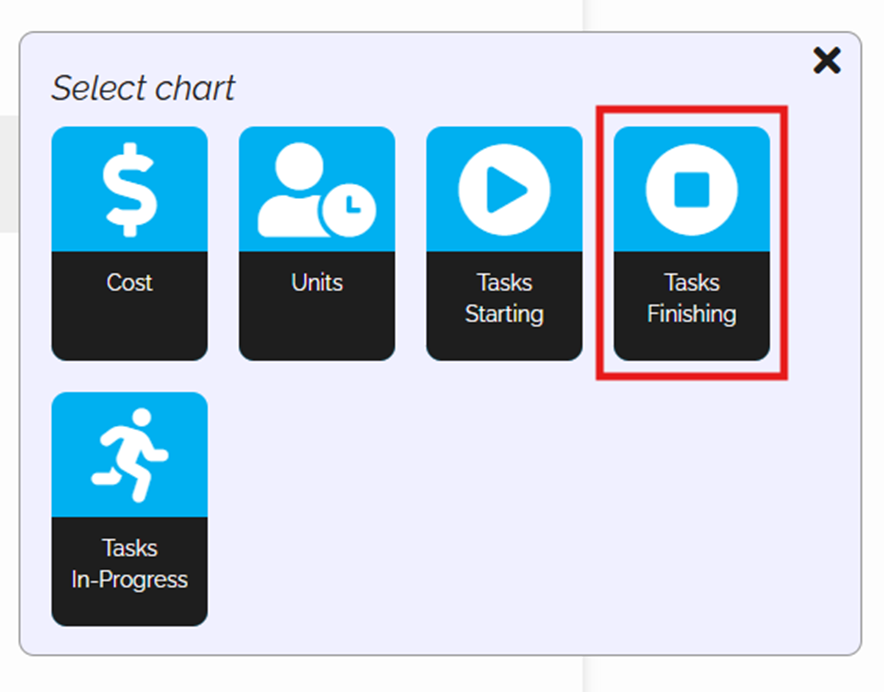
Then select which measurement you want, so lets choose Tasks Finishing…
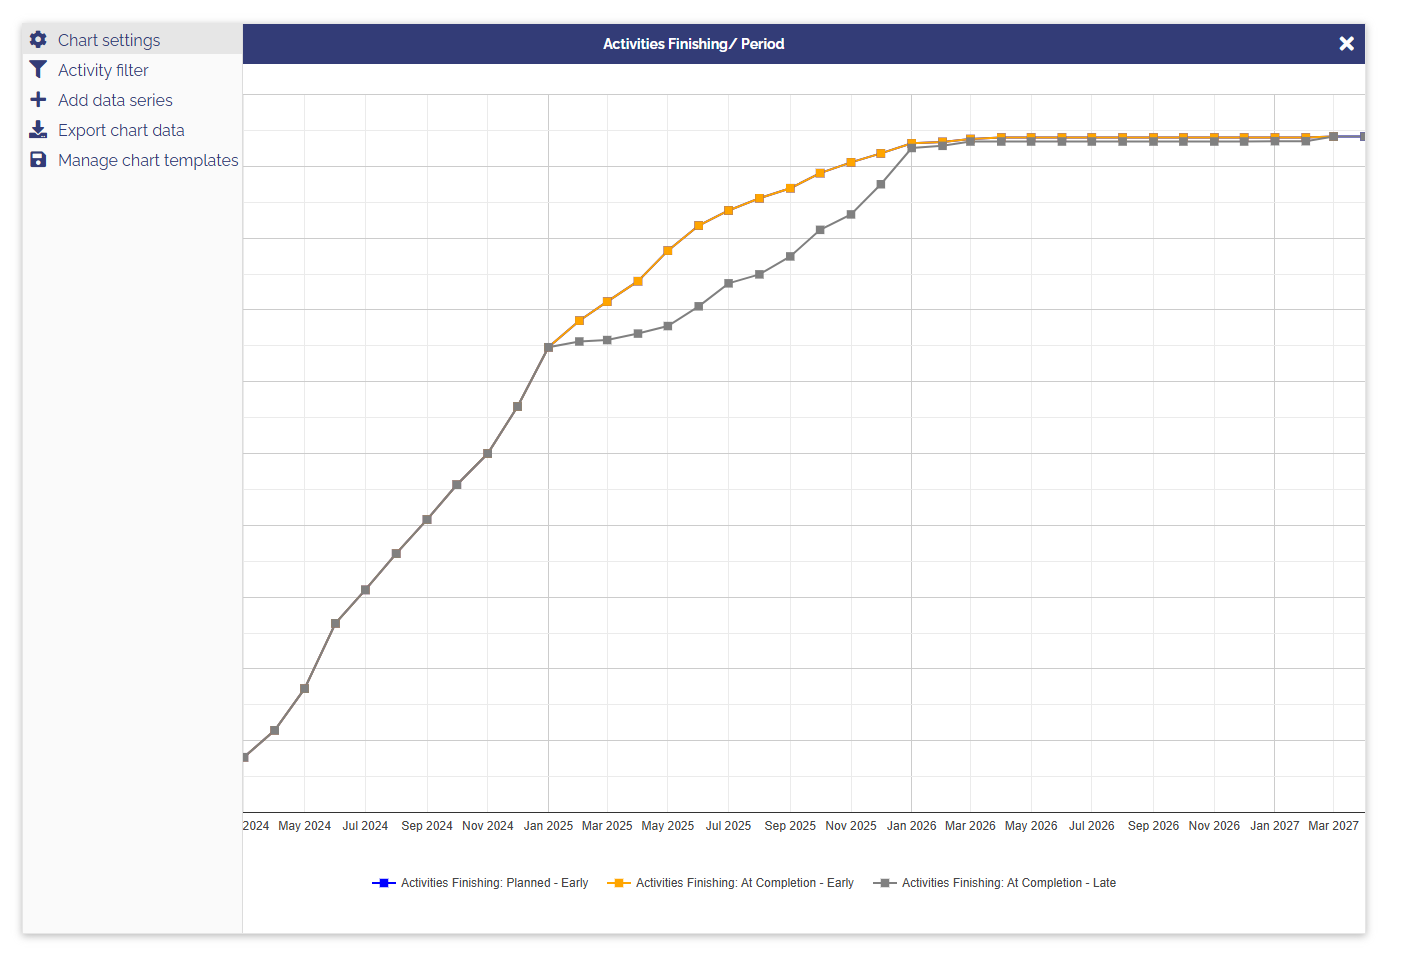
This will bring up an S Curve chart, so now we need to change what it will show in the “Chart Settings” in the hamburger menu at the top left hand corner of the ‘tile’
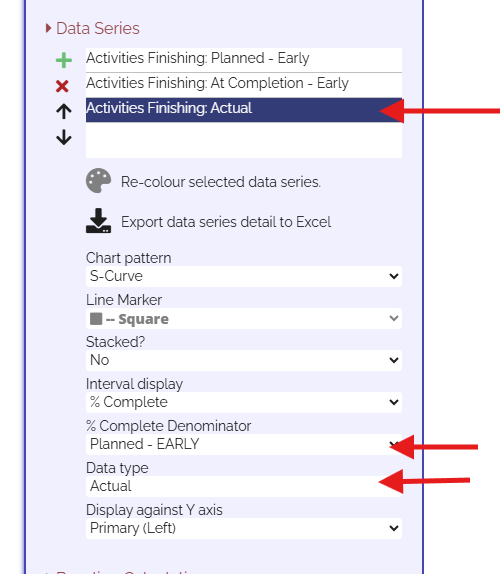
So here we want the curve to be based on %age complete, so with the “Activities Finishing: Planned - Early” selected, change the "Interval Display to “% Complete”

Then do the same for “Activities Finishing: At Completion - Early”
Then on the third line, “Activities Finishing: At Completion - Late”
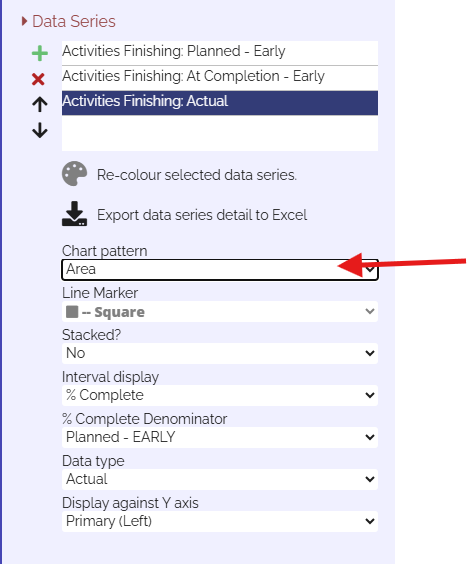
Change the “Interval Display” to “% Complete”, the “%Complete Denominator” to “Planned - Early” and then the “Data Type” to “Actual”
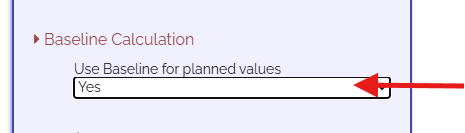
Then finally if you have a baseline, you can use that to calculate the results here…
You should see the chart updating as you change these settings… to make it clearer you can change the “Chart Pattern” for say the Actual to make it an Area rather than S Curve here…
Now you should start seeing a chart that looks like this…
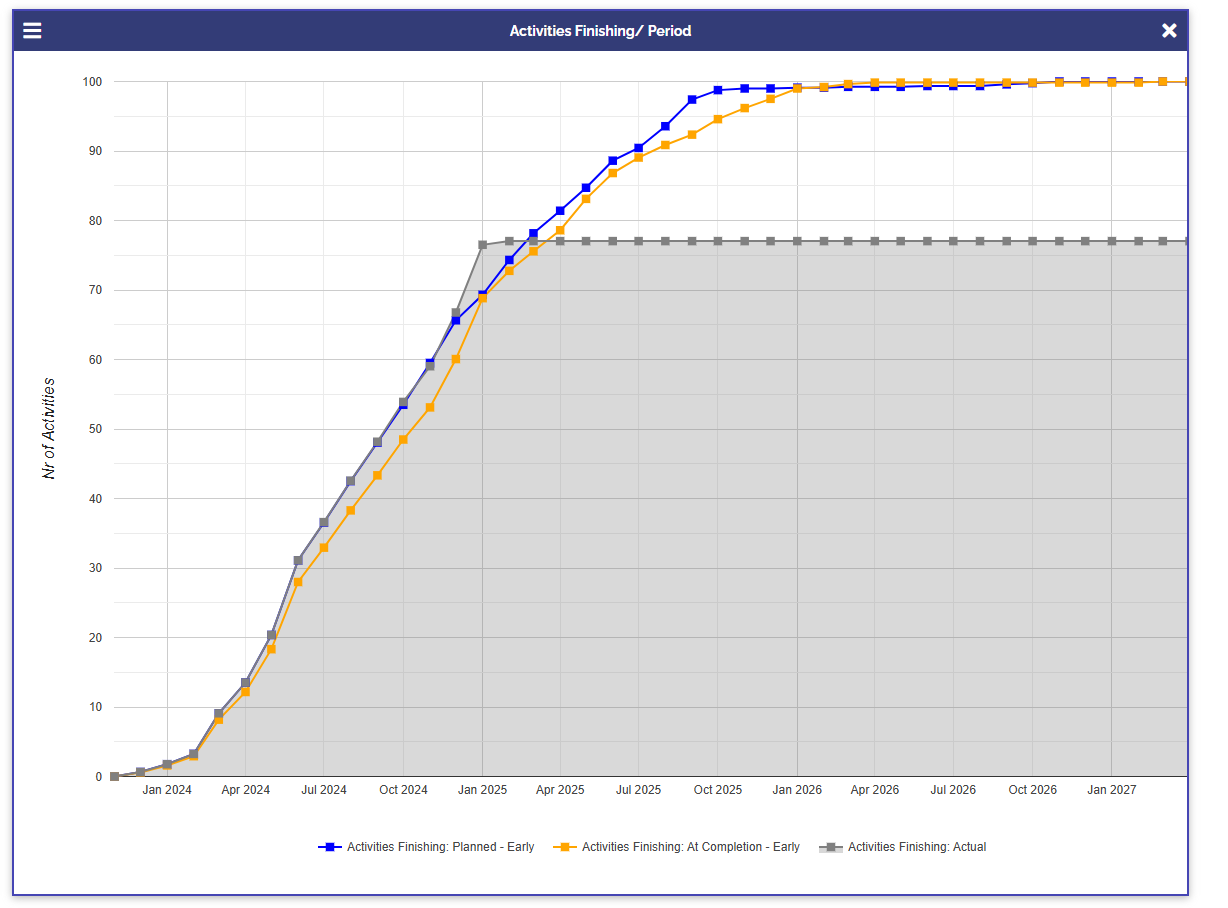
After that you can play with the colours and display of each line, change the axis titles and the title of the graph
I hope this helps!