- Below graph seems to be generated from number of activities; could same be generated from early and late dates and their %?
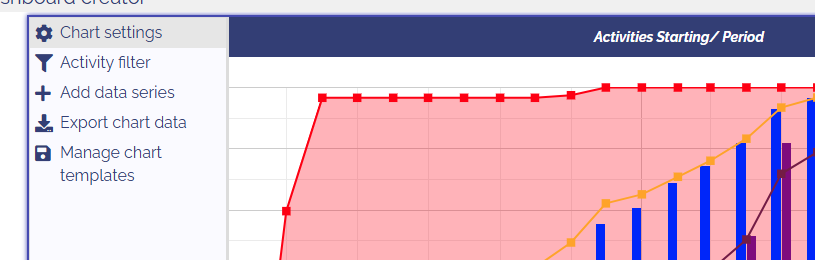
Yes, in the chart settings found in the hamburger menu
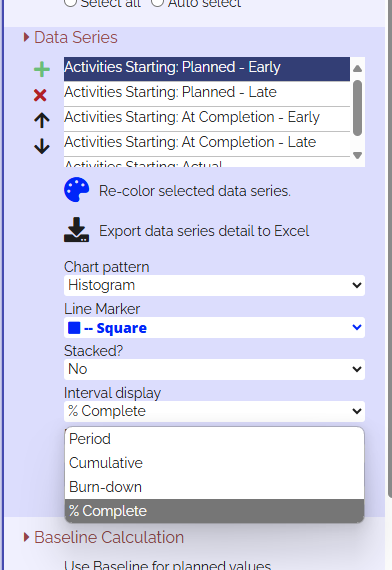
Then select the data series you wan to change to %age, then in the Interval Display settings, select % Complete… repeat for each data series
- The planned data should come from Baseline and actuals from current update; can we run it like that?
Yes, see this video for attaching a baseline…
Thanks
Chris