Our schedules are NOT cost or resource loaded. Is this something that XER Schedule Toolkit can do and if so, can you please send some sample reports?
Yes!.. the best way is using our dashboard tool… here is a video showing how to do it… How to produce an S Curve without cost or resource
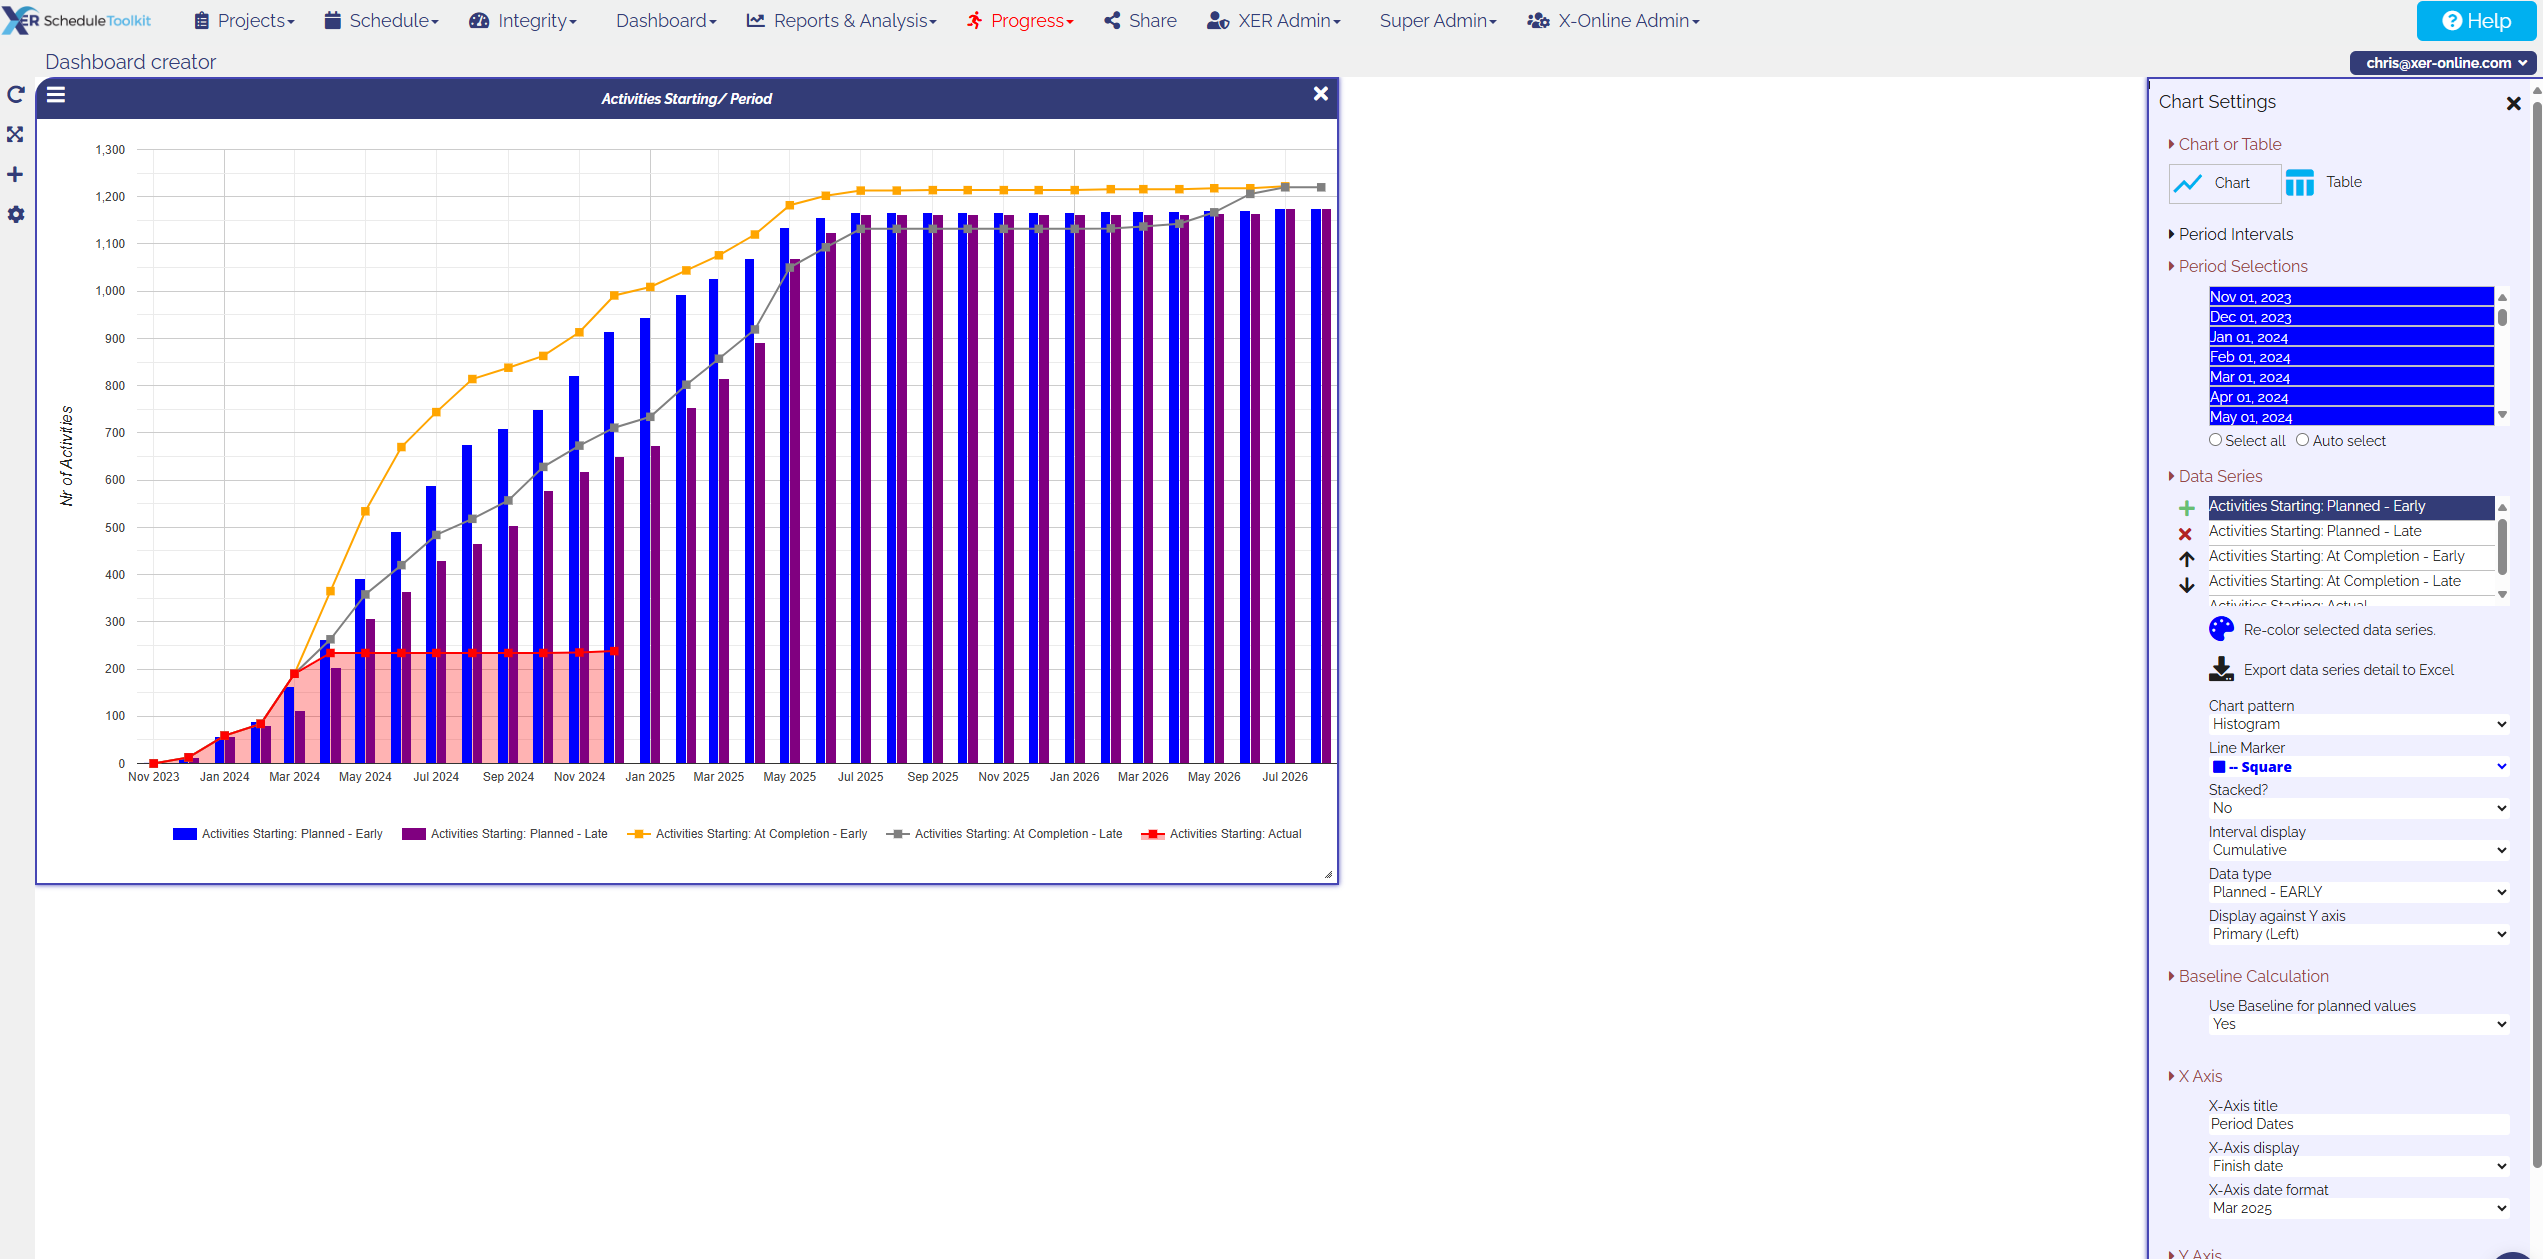
The graph seems to be generated from number of activities; could same be generated from early and late dates and their ?
The planned data should come from Baseline and actuals from current update; can we run it like that?
- Below graph seems to be generated from number of activities; could same be generated from early and late dates and their %?
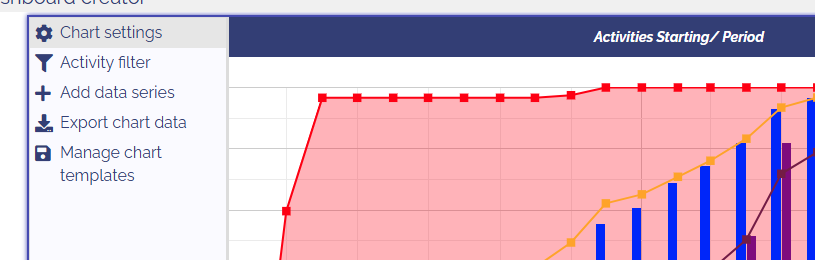
Yes, in the chart settings found in the hamburger menu
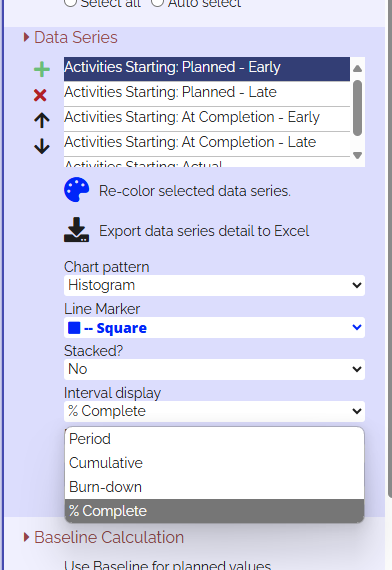
Then select the data series you wan to change to %age, then in the Interval Display settings, select % Complete… repeat for each data series
- The planned data should come from Baseline and actuals from current update; can we run it like that?
Yes, see this video for attaching a baseline…
Thanks
Chris